Last Updated June 29, 2025.
Knee Knacker runner Sean Lavin started doing some research related to weather on Race Day over the past dozen or so years.
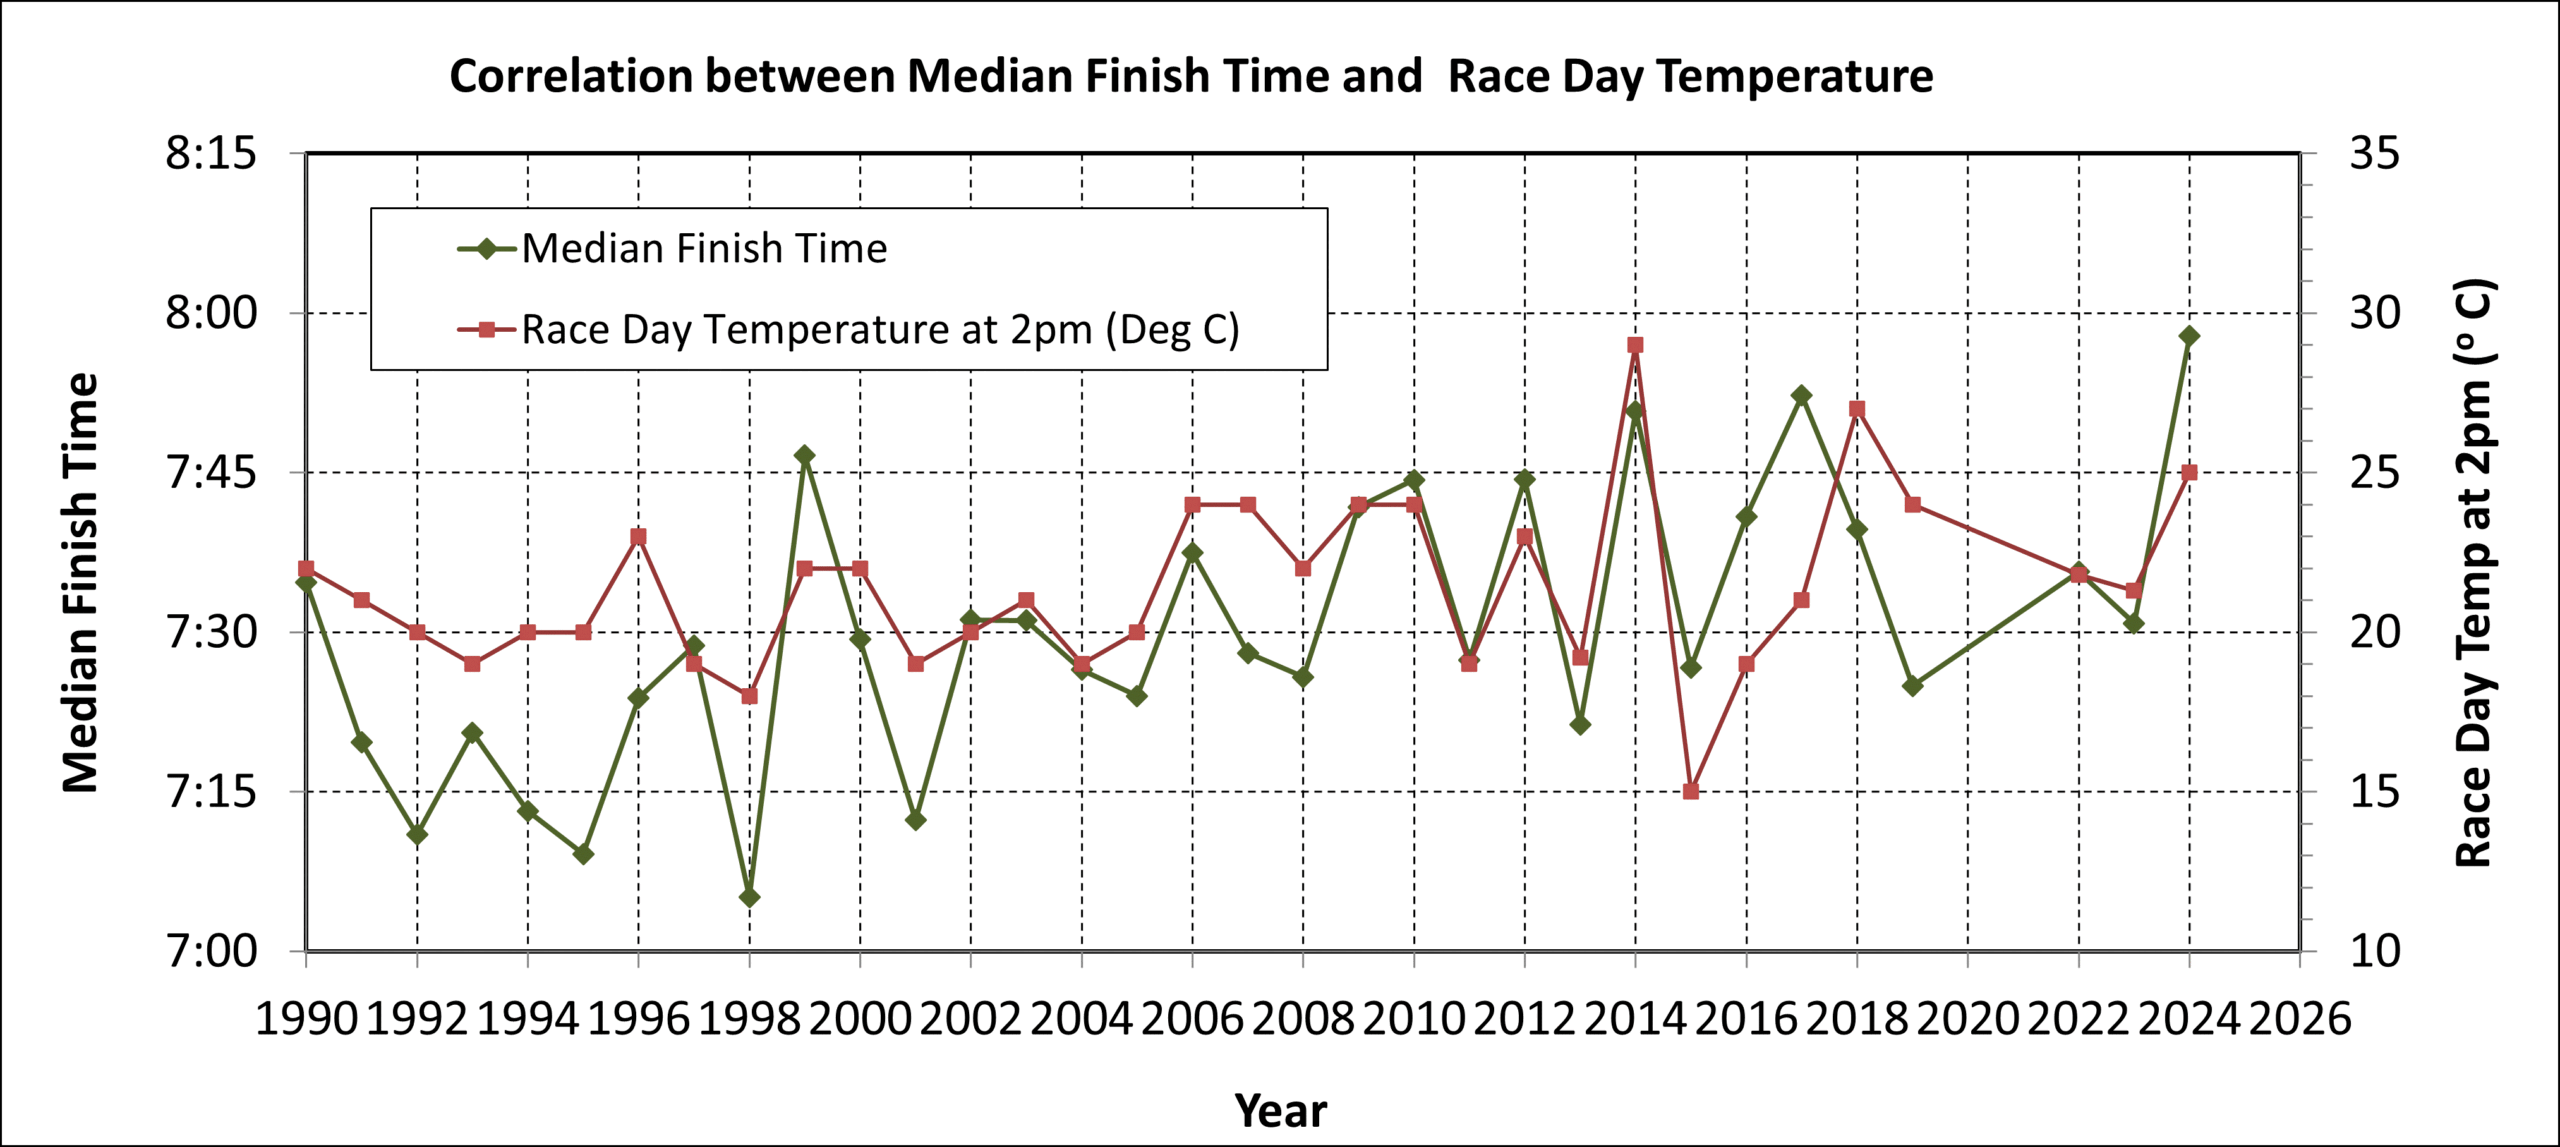
In 2013 (and beyond), Pat Malaviarachchi took it a step or two further. He brought the temperature data up to date (using race day temp at 2pm), and also overlaid it with the median finishing times over the years. Here is what it looks like:

As noted by Pat – “There’s definitely a trend going on between temperature and median finishing time, particularly in recent years (correlation coefficient is almost 0.7, which is pretty good). In 2014,the correlation got even stronger, increasing to 0.74!”.
Adding in data up to the current year, this dropped back down to just under 0.6 which is still considered strong.
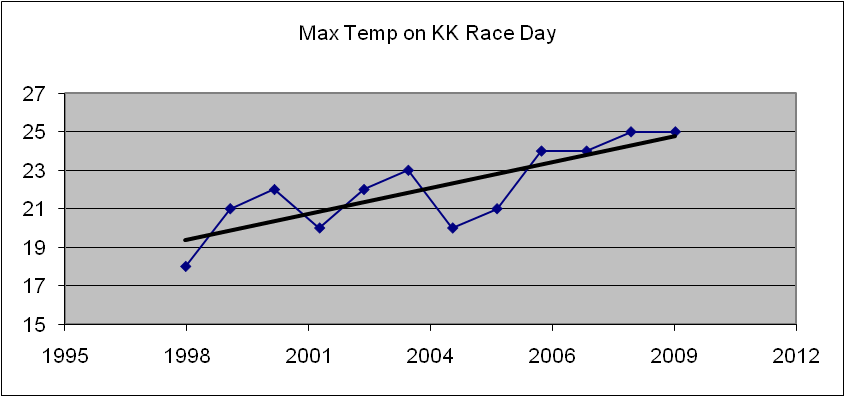
For historical reference, here is the first chart produced by Sean in 2010, showing the maximum temperatures (Celsius) on Race Day:
Many thanks, Pat (and Sean too)!


